What I See on the Charts
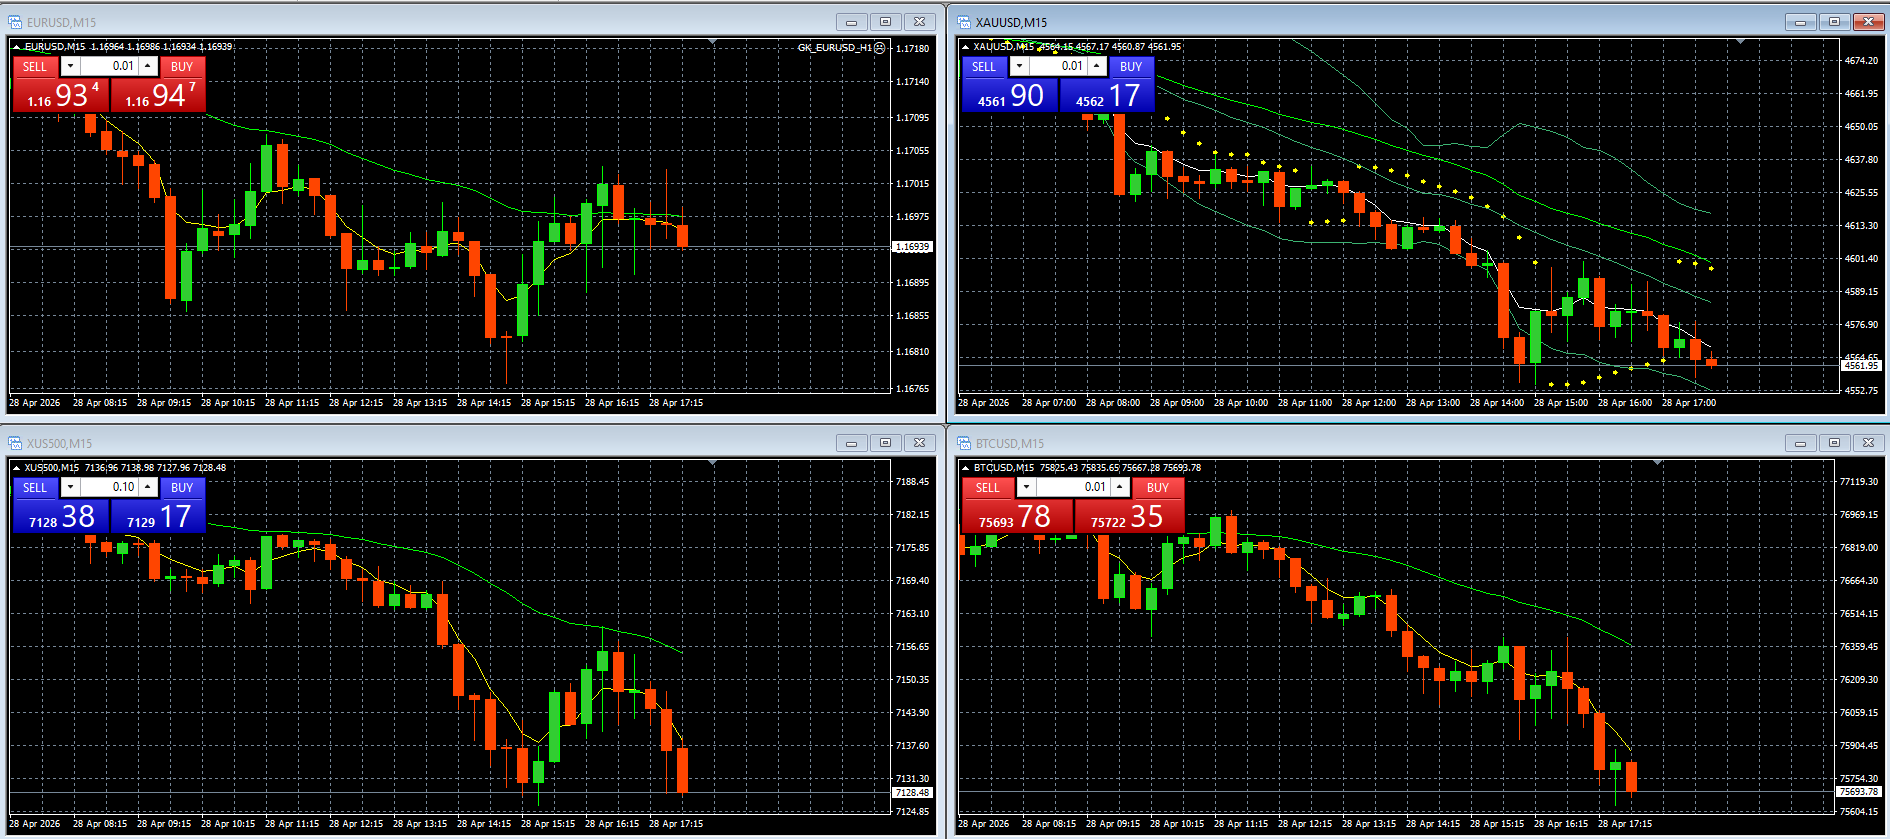
Looking at my MT4 account, showing the four panels, the picture is strikingly clear — broad-based risk-off selling across the board during today’s session:
| Instrument | Current Price | Intraday Trend |
|---|---|---|
| EUR/USD | ~1.1694 | Sold off hard from ~1.1710 highs, now pressing session lows |
| XAU/USD (Gold) | ~4,562 | Steep decline from ~4,650+ area, breaking below moving averages |
| XUS500 (S&P 500) | ~7,128 | Aggressive selloff from ~7,185 to session lows |
| BTC/USD | ~75,700 | Dropped sharply from ~76,800+, waterfall pattern |
All four charts show consecutive large red candles accelerating into the afternoon, with price slicing below short-term moving averages. This is not random — something fundamental is driving correlated selling.
🔑 The Most Likely Catalyst: UAE Quits OPEC
The biggest headline hitting today is that the United Arab Emirates has announced it will leave OPEC, delivering a major blow to the cartel that «will ripple through the global oil market at a time of unprecedented turmoil caused by the Iran war» .
This is a seismic geopolitical event and here’s why it’s hammering everything:
- Oil price shock expectations — The UAE leaving OPEC signals potential production increases and a breakdown of coordinated supply management. This creates massive uncertainty about future oil prices and energy market stability.
- Geopolitical risk amplification — This is happening against the backdrop of the Iran war , meaning the Middle East situation is deteriorating further. Markets hate uncertainty, and this adds a new layer of instability.
- Risk-off cascade — When a geopolitical shock of this magnitude hits:
- S&P 500 sells off → equity risk premium spikes
- Gold initially should rally as a safe haven, but the sharp drop you’re seeing suggests margin calls and forced liquidation — traders selling gold to cover losses elsewhere
- EUR/USD drops → flight to USD cash (dollar strength)
- BTC drops → crypto acts as a risk asset in panic environments, not a hedge
📊 Technical Read on the 15-Min Candles
The 15-minute timeframe is critical for intraday traders because it «provides an idea about the trend» and helps «identify entry and exit points» .
What I observe across all four charts:
- Three Black Crows-like patterns — multiple consecutive bearish candles with little to no upper wicks, indicating relentless selling pressure with no meaningful bounces
- Price is well below all visible moving averages (the green/yellow lines), confirming bearish momentum
- Volume appears to be increasing on the down moves (larger candle bodies)
- On Gold (XAU/USD), the parabolic SAR dots (yellow) have flipped above price — a classic sell signal
- During high volatility like this, candlestick patterns «serve as a visual representation of the tug-of-war between buyers and sellers» and «can offer sharp insights into market sentiment»
🔮 Most Probable Moves for the Rest of Today
Scenario 1 — Continued Selloff (60% probability):
- The OPEC news is still being digested. If oil markets react violently in the US session, expect further downside across all assets.
- S&P 500 could test 7,100 or lower
- Gold may find temporary support around 4,540–4,550 but could flush to 4,500
- BTC likely tests 75,000 psychological level
- EUR/USD could slide toward 1.1660–1.1670
Scenario 2 — Oversold Bounce / Dead Cat Bounce (30% probability):
- After such aggressive selling, a short-covering rally into the US close is possible
- Watch for a hammer or doji candle on the 15-min chart near current levels — that would signal exhaustion of sellers
- Bounces would likely be shallow and sold into
Scenario 3 — V-Shape Recovery (10% probability):
- Only if a major policy response emerges (e.g., central bank statement, diplomatic breakthrough)
- Unlikely given the structural nature of the UAE/OPEC news
⚠️ Key Levels to Watch
| Asset | Support | Resistance |
|---|---|---|
| EUR/USD | 1.1660 | 1.1710 |
| Gold | 4,540 / 4,500 | 4,600 |
| S&P 500 | 7,100 / 7,080 | 7,155 |
| BTC | 75,000 | 76,000 |
Bottom line: The UAE leaving OPEC amid the Iran war is a genuine macro shock . The correlated selloff across equities, gold, crypto, and EUR/USD screams panic liquidation and risk-off positioning. Be extremely cautious with longs today — the path of least resistance remains down until markets find a floor and digest this news. If you’re trading, tight stops are essential. 🎯
Disclaimer: This is analysis, not financial advice. Always manage your risk.
