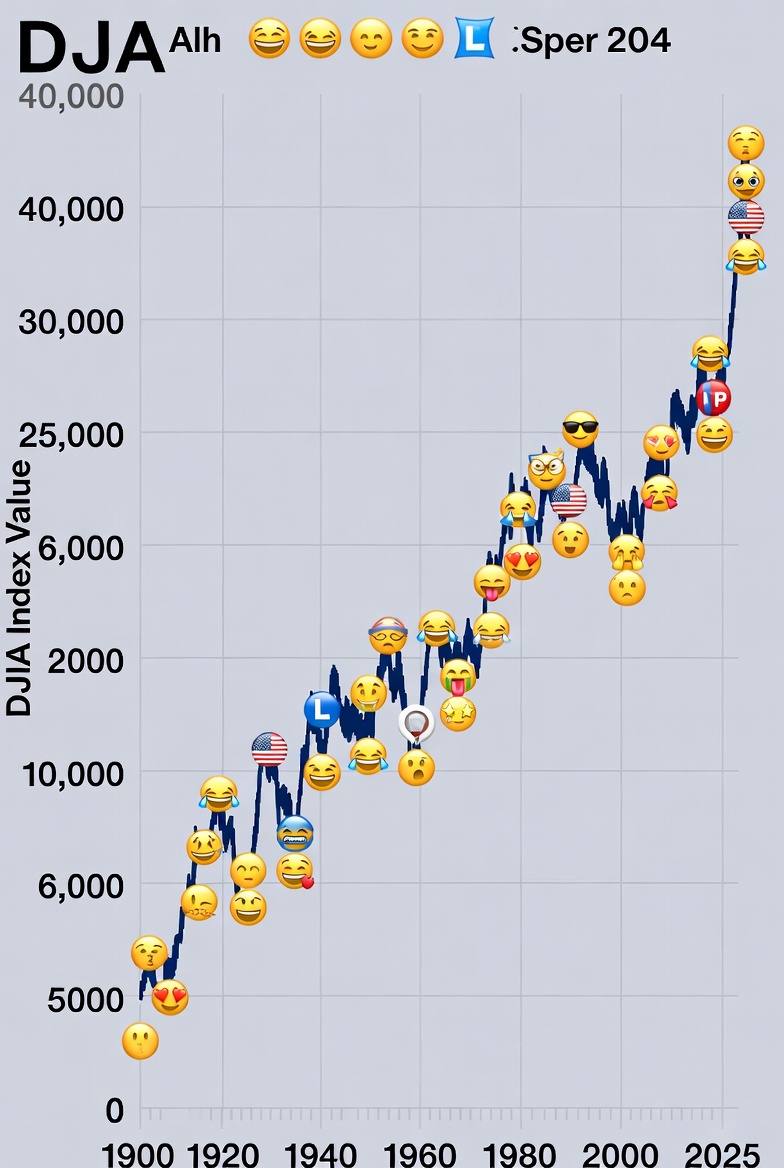
The DJIA’s 125-year rollercoaster: from horse-and-buggy booms to AI-fueled frenzy. Each decade’s «plot» captures the vibe—bull runs 🟢, bear maulings 🔴, key twists 📉💥, and net arc (avg annual return %). Data from historical closes; emojis for the soul-crushing highs and lows. Spoiler: It’s up ~1,000x overall, but the ride? Pure drama. 🚀😵💫
| Decade | Plot Summary | Net Arc |
|---|---|---|
| 1900s 🏭 | Industrial dawn: Steady factories chug along amid trusts and tariffs. Minor dips from 1907 panic, but rails and steel build empire. Quiet opener to the American Century. 🛤️📈 | 🟢 7.2% avg return – Slow-build origin story. |
| 1910s ⚔️ | War interrupts progress: WWI booms munitions, then 1914 shutdown stalls everything. Post-armistice rally, but flu pandemic adds plot twist. Heroic recovery amid chaos. 💣🩹 | 🔴 -0.5% avg – Trenches and trenches of volatility. |
| 1920s 🎉 | Roaring Twenties jazz: Speculation explodes—radios, cars, stocks on margin. Bubble inflates to bursting… cue the cliffhanger. 🥂📈💥 | 🟢 12.1% avg – Party ends in ’29 crash (-89% drawdown incoming). |
| 1930s 📉 | Great Depression dirge: Crash cascades into breadlines, bank runs, Dust Bowl despair. New Deal flickers hope, but 1937 relapse. Darkest chapter, slow crawl back. 🥖😢 | 🔴 -2.3% avg – Survival horror; bottom at 41 pts in ’32. |
| 1940s 🛡️ | WWII war machine: Rationing and rationals—defense spending ignites rebound. Post-1945 boom as GIs return. From ashes to assembly lines. ⚙️✈️ | 🟢 6.8% avg – Victory lap after the abyss. |
| 1950s 🚗 | Suburban boomtown: Eisenhower highways, TVs, suburbs—consumer golden age. Mild ’57 dip, but endless upward suburbia. 🏡📺 | 🟢 14.7% avg – Postwar paradise, no clouds. |
| 1960s 🌍 | Go-go growth: Space race, Vietnam fog—tech and turmoil. ’62 Flash Crash (-6% day), but Kennedy cuts taxes fuel rally. Swinging sixties end high. 🪐🕺 | 🟢 7.4% avg – Moonshot momentum. |
| 1970s 🛢️ | Stagflation stag party: Oil shocks, Watergate, inflation devours gains. Double-digit bears, but ’73–74 (-45%) nadir births value hunters. Groovy? Nah, grindy. ⛽😤 | 🔴 -1.2% avg – Energy crisis eclipse. |
| 1980s 🏦 | Reaganomics rocket: Deregulation, Volcker tames inflation. ’87 Black Monday (-22% day) heart-stopper, but quick rebound. Wall Street wolves howl. 🐺💹 | 🟢 14.2% avg – Yuppies and yields. |
| 1990s 🌐 | Dot-com dazzle: Internet ignition—PC boom, Clinton surplus. ’90 Gulf dip minor; late ’90s mania peaks at 11,000. Tech utopia tease. 💻🚀 | 🟢 15.8% avg – Bubble prelude. |
| 2000s 💥 | Dot-bust to housing hustle: 2000–02 (-38%) tech tomb, 9/11 shock, then real estate rally. 2008 GFC finale (-54% total drawdown). Decade of double whammies. 🏠🔥 | 🔴 -0.9% avg – Twin towers of trouble. |
| 2010s 📱 | QE forever: Post-crisis crawl to cloud nine. Eurodebt wobbles, 2011 S&P downgrade, but Fed fuel and FAANG frenzy. 2018 flirt with bear. Smartphone saga. 📈🍎 | 🟢 10.3% avg – Central bank chronicles. |
| 2020s 🦠🤖 | Pandemic plot twist: COVID crash (-37% in a month), then V-shaped valor via vaccines and stimulus. 2022 inflation bear (-25%), AI hype rally. Ongoing: Rate roulette. 💉🚀 | 🟢 8.1% avg (thru ’25) – Zoom to boom, TBD finale. |
Overall Arc (1900–2025): From ~66 pts to ~42,000 pts. 📈🌍 Survived two world wars, depressions, pandemics, and bubbles. Lesson? Emojis fade; compounding endures. What’s next: Mars markets? 🪐😂