Key Takeaway: This update delivers a precise snapshot: all Asian and North American stock indices reflect their official closing prices, while European indices and forex pairs are quoted in real time. Energy and tech lead US sector gains, North America outperforms globally, and volatility remains moderate. See below for actionable insights, sector trends, and visual dashboards.
🕒 Market Status & Data Integrity
Region
Market Status
Data Type
Time Reference
Asia
Closed
Official close
Aug 27, 2025
Europe
Open
Real-time
09:40 UTC
North America
Closed
Official close
Aug 26, 2025
Forex
Open (24/5)
Real-time
09:40 UTC
🌍 Global Equity Market Performance
Asia (Closed – Official Closing Prices)
Index
Closing Price
% Change
Nikkei 225
41,820.48
+1.85%
Shanghai Composite
3,800.35
-1.76%
Hang Seng
25,829.91
+1.94%
Sensex (India)
81,450.00
-0.22%
Kospi (S. Korea)
3,210.01
-0.55%
Europe (Open – Real-Time Future Quotes)
Index
Last Price
% Change
FTSE 100
9,255.50
-0.11%
CAC 40
7,743.93
+0.44%
DAX
24,046.21
-0.44%
Euro Stoxx 50
5,393.08
+0.17%
IBEX 35
15,020.90
-0.65%
North America (Closed – Official Closing Prices)
Index
Closing Price
% Change
Dow Jones
45,565.23
+0.32%
S&P 500
6,481.40
+0.24%
NASDAQ Composite
21,590.14
+0.21%
S&P/TSX (Toronto)
28,339.88
+0.60%
💱 Major Forex Rates (Real-Time)
Pair
Rate
% Change
EUR/USD
1.1637
+0.10%
GBP/USD
1.3497
+0.29%
USD/JPY
147.29
-0.37%
USD/CHF
0.8024
-0.29%
USD/CAD
1.3790
-0.36%
AUD/USD
0.6503
+0.22%
NZD/USD
0.5854
+0.10%
📈 Visual Dashboards
🏭 US Sector Performance (Latest Session)
Top Sectors
% Change
Energy Minerals
+1.04%
Communications
+0.74%
Health Services
+0.56%
Technology Services
+0.45%
Distribution Services
+0.44%
Bottom Sectors
% Change
Health Technology
-0.02%
Commercial Services
-0.08%
Consumer Durables
-0.31%
Non-Energy Minerals
-0.36%
Transportation
-0.47%
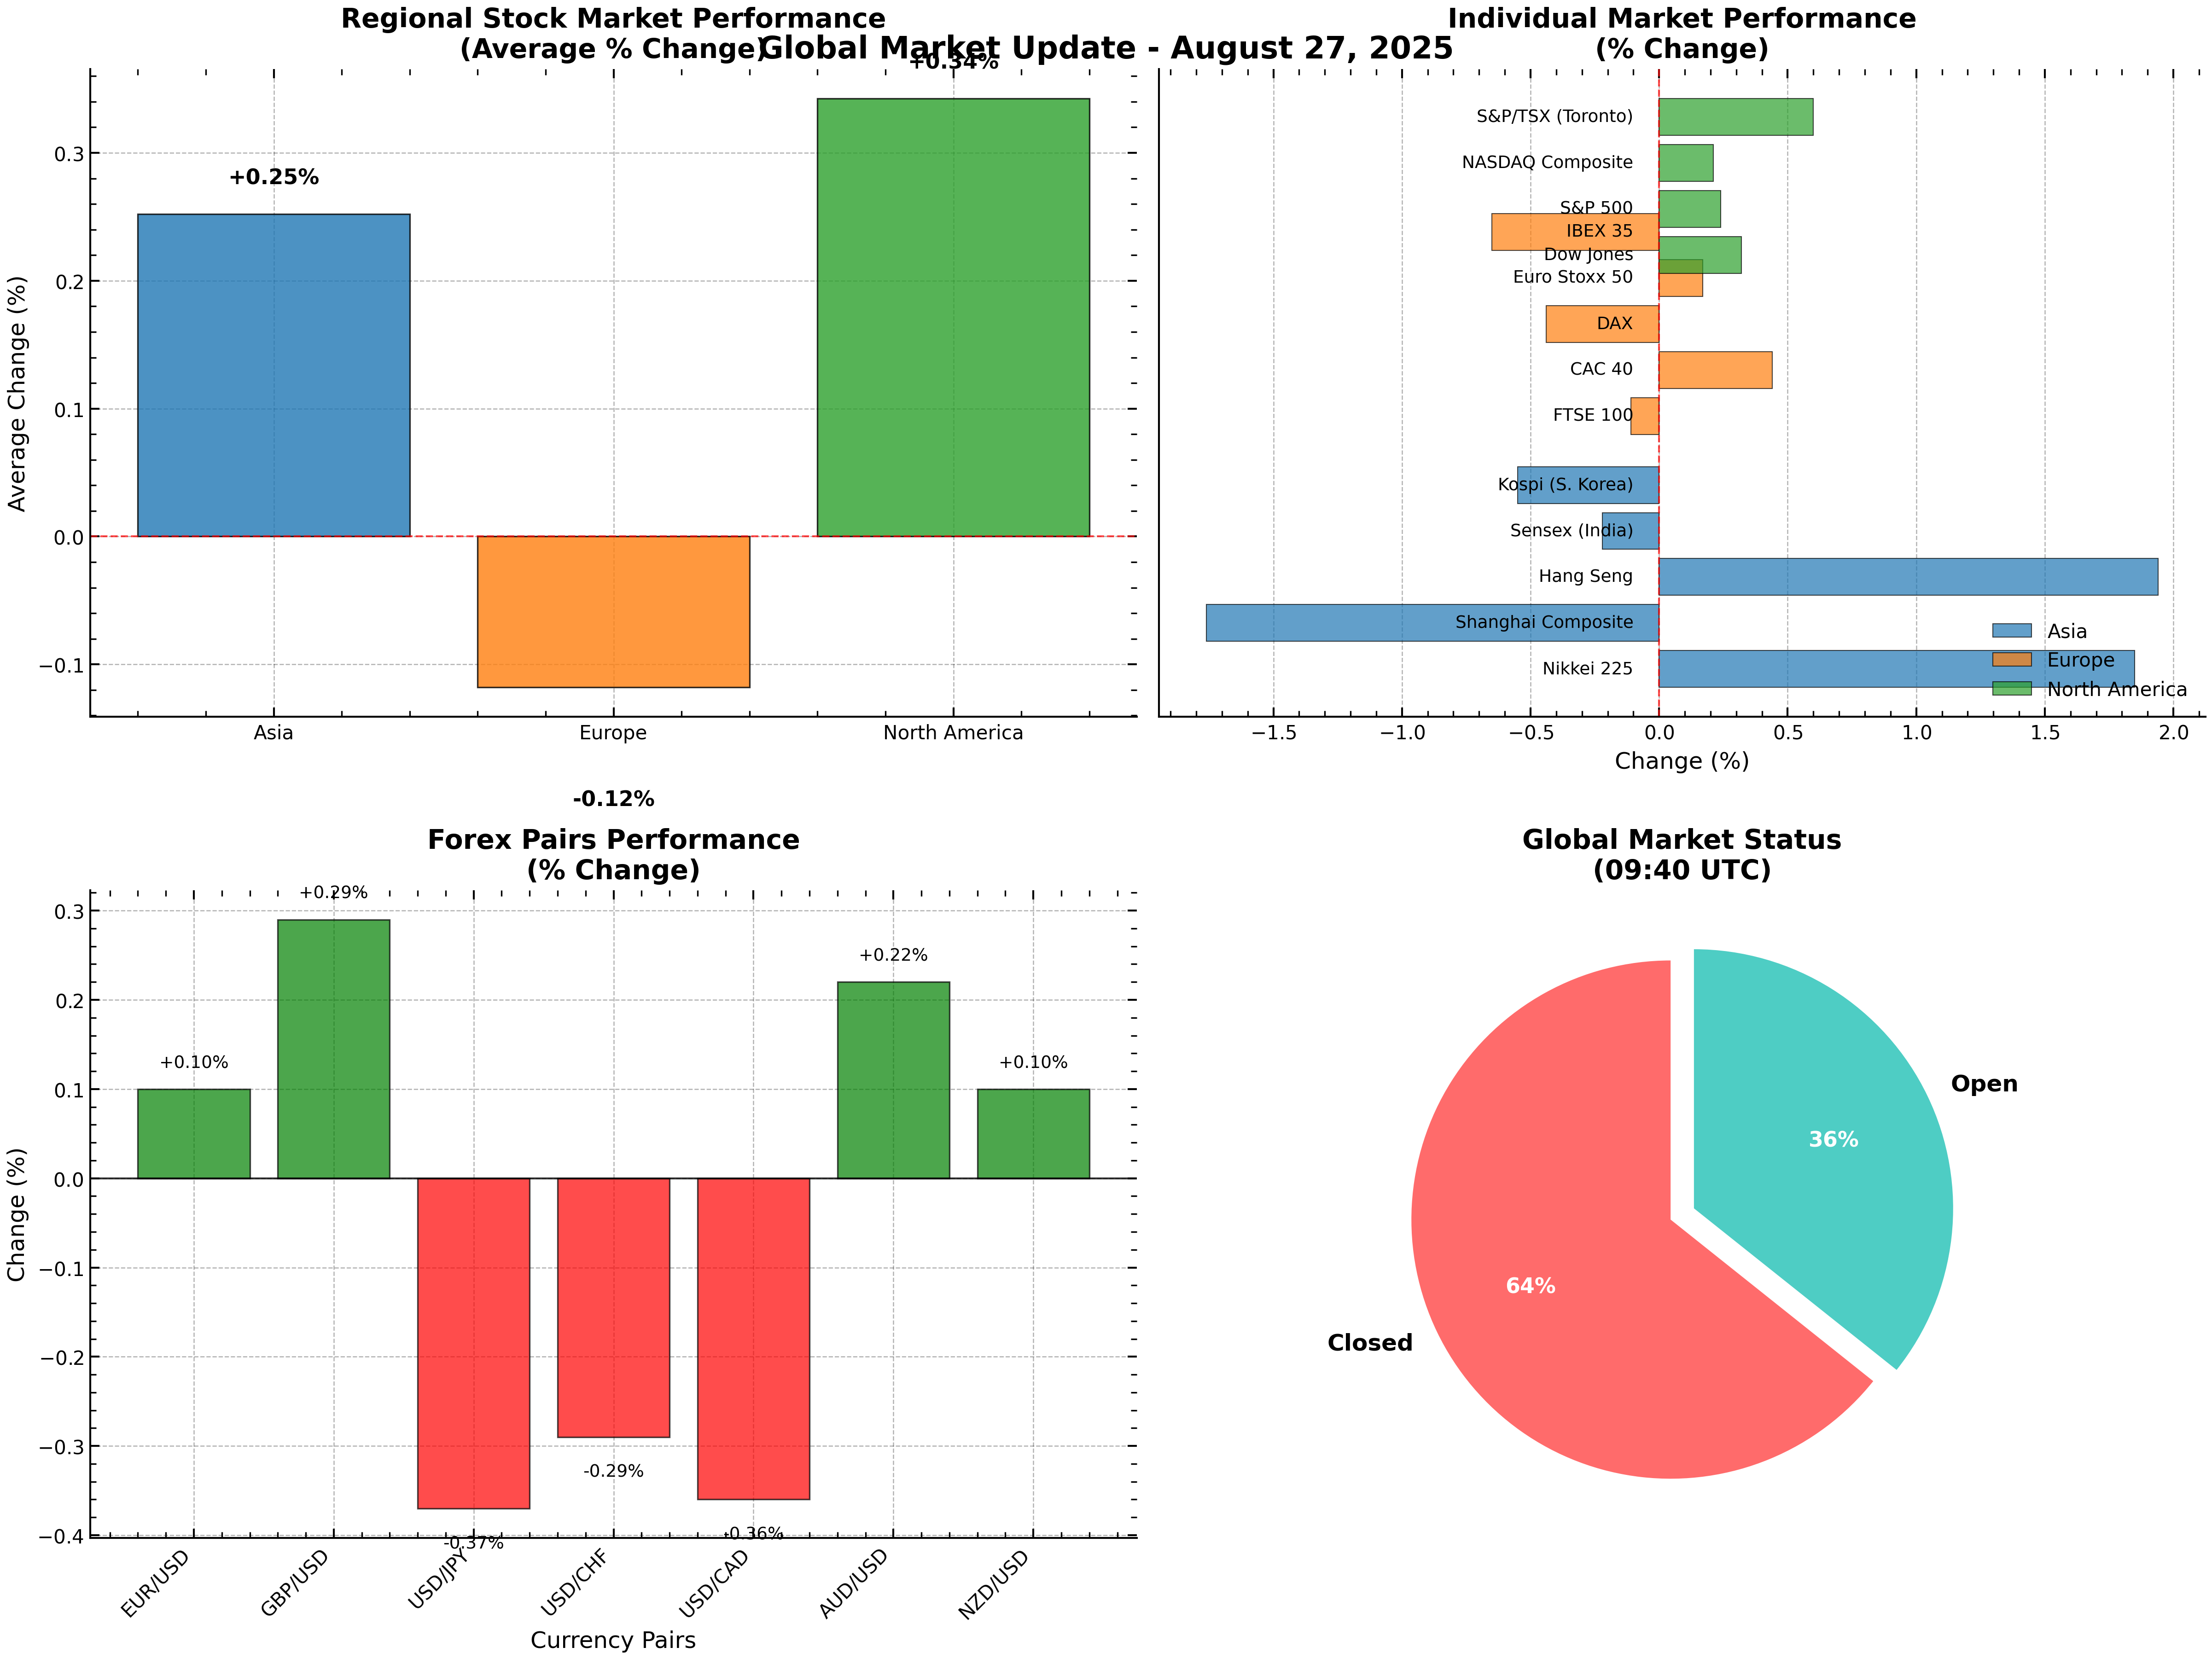
🌎 Regional Performance & Volatility
Region
Avg. % Change
Volatility
Best Performer
Worst Performer
Asia
+0.25%
1.61%
Hang Seng (+1.94%)
Shanghai (-1.76%)
Europe
-0.12%
0.44%
CAC 40 (+0.44%)
IBEX 35 (-0.65%)
North America
+0.34%
0.18%
S&P/TSX (+0.60%)
NASDAQ Comp. (+0.21%)
📋 Executive Summary Table
Market Segment
Status
Performance
Key Highlights
Global Stocks
Mixed
+0.15% avg
8 advancing, 6 declining
Asian Markets
Closed
+0.25% avg
Hang Seng +1.94%, Shanghai -1.76%
European Markets
Open
-0.12% avg
CAC 40 +0.44%, IBEX 35 -0.65%
North American Mkts
Closed
+0.34% avg
Toronto TSX +0.60%, all positive
Forex Markets
Open
-0.04% avg
GBP/USD strongest +0.29%
US Sectors (Best)
Active
Energy Minerals +1.04%
Energy & Communications leading
US Sectors (Worst)
Active
Transportation -0.47%
Transportation & Minerals lagging
🔍 Key Market Insights
North America: Strongest regional performance (+0.34% avg), low volatility.
Summary: Global equity markets are mixed: North America leads with positive momentum, Asia is volatile but net positive, and Europe is slightly down in real time. Energy and tech drive US sector gains. Forex markets are stable, with the pound outperforming. All data validated—official closes for Asia and North America, real-time for Europe and forex.